The Received Signal Strength Indicator (RSSI) scale is generally used to calculate received radio signal strengths. The EIRP levels going out the transmitter’s antenna when using wireless LAN devices typically vary from 100 mW to 1 mW or +20 dBm to 0 dBm. The receiver’s antenna receives signal levels from 1 mW to almost 0 mW or 0 dBm to -100 dBm. Received Signal Strength Indicator (RSSI) is a useful measurement in a WiFi network to determine a good wireless connection and if it’s receiving acceptable signal strength or WiFi signal. According to the 802.11 specifications, the RSSI value is a 1-byte internal relative value that ranges from 0 to 255, with 255 being the strongest value.
The RSSI values could be scaled and converted to correspond to their actual power or dBm values. It has no relationship with any particular physical parameter. Therefore, the results may not be consistent among different receiver manufacturers, and the RSSI values may change depending on the receiver hardware.
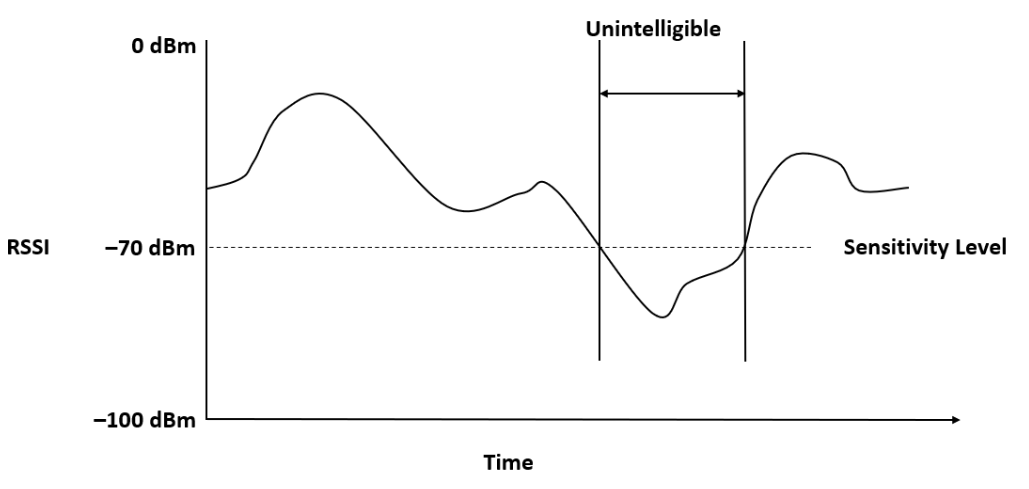
RSSI Receiver Sensitivity Level
The receiver has a sensitivity level or threshold that distinguishes understandable and helpful signals. The data from a received signal can be appropriately interpreted if it has a power level higher than the receiver’s sensitivity level. The receiver’s sensitivity level in the image below is at -70 dBm. The power level below -70 dBm is regarded as unintelligible, and there is a high chance that it will not be understood correctly by the receiver.
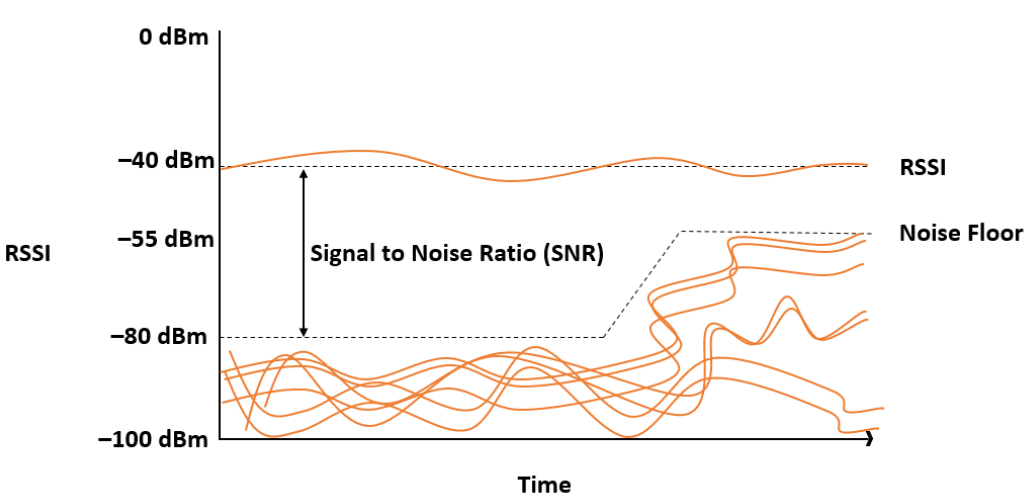
Signal-to-Noise Ratio
The RSSI values represent the received signal’s relative quality relative to the expected signal. The other signals received on the same receiving frequency are considered noise. The noise floor is the noise level or the average signal strength.
It is easy to ignore the noise as long as the noise floor is far below what the receiver is attempting to receive. For an RF signal to be properly received and understood, the signal strength must be significantly higher than the noise floor. The signal-to-noise ratio (SNR) in dB is the difference between the signal and the noise. It is recommended that the SNR value must be higher.
The image below compares an RF signal’s received signal strength and the received noise floor. The signal strength is around -40 dBm, and the noise floor is -80 dBm. The SNR would be -40 dBm or 40 dB (-40 dBm – -80 dBm). On the right side of the graph, the noise floor increases to -55 dBm, so the SNR value decreases to 15 dB (-40 dBm – -55 dBm). The signal might not be usable since the signal and the noise floor are very close.
Download our Free CCNA Study Guide PDF for complete notes on all the CCNA 200-301 exam topics in one book.
We recommend the Cisco CCNA Gold Bootcamp as your main CCNA training course. It’s the highest rated Cisco course online with an average rating of 4.8 from over 30,000 public reviews and is the gold standard in CCNA training: